Lies, Damn lies and Statistics
In order to compare the performances of datagrepper in the different configuration we looked at, we wrote a small script that runs 30 requests in 10 parallel threads.
These requests are:
filter_by_topic:
/raw?topic=org.fedoraproject.prod.copr.chroot.startplain_raw:
/rawfilter_by_category:
/raw?category=gitfilter_by_username:
/raw?user=pingoufilter_by_package:
/raw?package=kernelget_by_id:
/id?id=2019-cc9e2d43-6b17-4125-a460-9257b0e52d84
We have then 4 different environments:
prod/openshift: this is an openshift deployment of datagrepper hitting the production database, without any configuration change.
prod/aws: this is an AWS deployment of datagrepper, hitting its own local database, with the
DEFAULT_QUERY_DELTAconfiguration key set to 3 days.partition/aws: this is an AWS deployment of datagrepper, hitting its own local postgresql database where the
messagestable is partition byidwith each partition having 10 million records and theDEFAULT_QUERY_DELTAconfiguration key set to 3 days.timescaledb/aws: this is an AWS deployment of datagrepper, hitting its own local postgresql database where the
messagestable as been partition via the timescaledb plugin and theDEFAULT_QUERY_DELTAconfiguration key set to 3 days.
Results
Here are the results for each environment and request.
prod/openshift
filter_by_topic |
0.32 |
NA |
45.857601 |
0.00% |
plain_raw |
0.32 |
NA |
31.955371 |
0.00% |
filter_by_category |
0.32 |
NA |
31.632514 |
0.00% |
filter_by_username |
0.32 |
NA |
33.549061 |
0.00% |
filter_by_package |
0.32 |
NA |
34.531207 |
0.00% |
get_by_id |
1.57 |
1.575608 |
31.259095 |
86.67% |
prod/aws
filter_by_topic |
7.6 |
1.0068 |
11.2743 |
100.00% |
plain_raw |
9.06 |
0.712975 |
3.323922 |
100.00% |
filter_by_category |
12.43 |
0.489915 |
1.676223 |
100.00% |
filter_by_username |
1.49 |
5.83623 |
10.661274 |
100.00% |
filter_by_package |
0 |
52.69256 |
120.229874 |
1.00% |
get_by_id |
0.73 |
1.534168 |
60.455334 |
83.33% |
partition/aws
filter_by_topic |
9.98 |
0.711219 |
3.204178 |
100.00% |
plain_raw |
9.70 |
0.641497 |
1.24704 |
100.00% |
filter_by_category |
13.32 |
0.455219 |
0.594465 |
100.00% |
filter_by_username |
1.3 |
7.084018 |
12.079198 |
100.00% |
filter_by_package |
0 |
55.231556 |
120.125013 |
1.00% |
get_by_id |
0.48 |
2.198211 |
60.444765 |
76.67% |
timescaledb/aws
filter_by_topic |
14.1 |
0.4286 |
0.514617 |
100.00% |
plain_raw |
12.89 |
0.48235 |
0.661073 |
100.00% |
filter_by_category |
13.94 |
0.423172 |
0.507337 |
100.00% |
filter_by_username |
2.68 |
3.188782 |
5.096244 |
100.00% |
filter_by_package |
0.26 |
33.216631 |
57.901159 |
100.00% |
get_by_id |
12.69 |
0.749068 |
1.73515 |
100.00% |
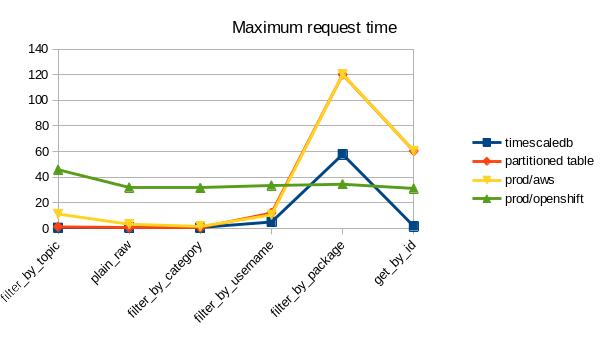
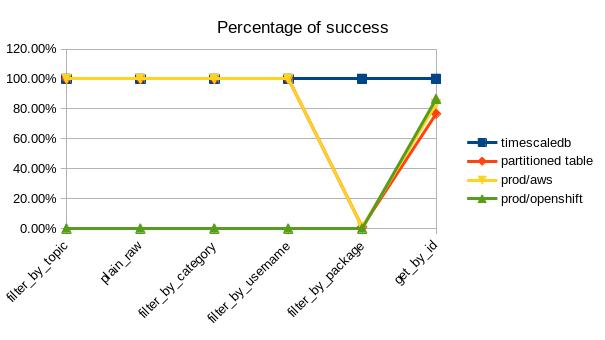
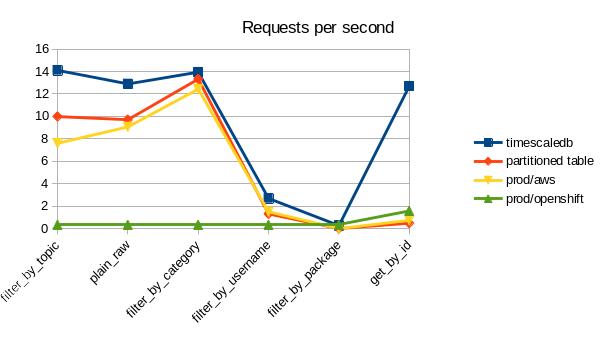
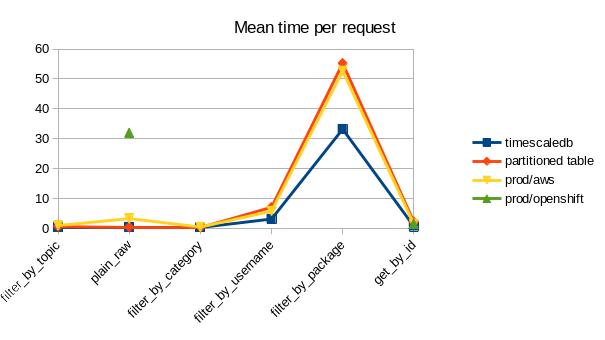
Graphs
Here are the same results graphed per request rather than environment.
Percentage of success
Requests per second
Mean time per request
Maximum time per request